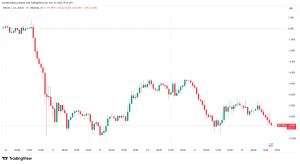











How to read crypto charts in 2025 (even if you’re a beginner)
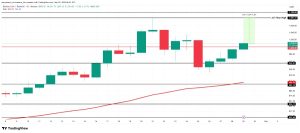
Key takeaways Crypto charts display open-high-low-close (OHLC) data. OHLC data helps traders track price movements, analyze volatility and identify trading opportunities. The X-axis represents timeframes, while the Y-axis shows price levels, either on a linear ادامه مطلب